


Introduction: Why UML Profiles Matter in Modern Software Architecture
As someone who has spent years navigating the complexities of software modeling, I’ve often found myself wishing UML could speak my domain’s language more fluently. Standard UML is powerful, but when modeling specialized systems—whether in healthcare, finance, or embedded automotive software—the generic constructs can feel like wearing a one-size-fits-all suit. That’s where UML Profile Diagrams changed my workflow entirely.

This guide shares my hands-on experience learning, creating, and leveraging UML Profile Diagrams using Visual Paradigm’s ecosystem. Whether you’re a seasoned architect or just exploring domain-specific modeling, I’ll walk you through the concepts, practical tutorials, and the exciting AI-powered features that have transformed how I approach extensible modeling.
Understanding Profile Diagrams: The “Lightweight Extension” Powerhouse
When I first encountered Profile Diagrams, I thought of them as UML’s customization toolkit. A Profile Diagram is a structural UML diagram that provides a generic extension mechanism for tailoring UML models to specific domains or platforms. Instead of reinventing the modeling wheel, profiles let you refine standard semantics in a strictly additive way—no contradictions, just enhancements.
Profiles are built using three core extensibility mechanisms:
Stereotypes: Speaking Your Domain’s Language

Stereotypes expand UML’s vocabulary by letting you create new model elements derived from existing ones but tailored to your problem domain. In my network modeling projects, stereotypes like <<router>>, <<switch>>, and <<hub>> made diagrams instantly recognizable to infrastructure teams. Stereotypes can even introduce custom graphical symbols, making models more intuitive.
Tagged Values: Adding Contextual Metadata
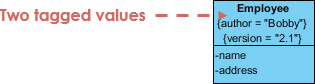
Tagged values let you attach keyword-value pairs to model elements. During a release management project, I used tagged values to track version numbers, test results, and deployment status directly on subsystem classes. This proved invaluable for:
-
Code generation scripts
-
Version control integration
-
Configuration management dashboards
-
Documenting authorship and review states
Constraints: Enforcing Domain Rules
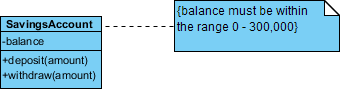
Constraints specify conditions that must always hold true. In real-time system modeling, I’ve used constraints like {responseTime < 50ms} or {xor} relationships to enforce architectural rules. Graphically rendered as bracketed strings near elements, constraints keep models semantically precise without cluttering the visual design.
When to Reach for a Profile Diagram
After experimenting with various modeling approaches, I’ve found Profile Diagrams most valuable when:
-
Domain-Specific Modeling: Your industry has unique concepts not covered by standard UML (e.g., medical devices, financial instruments).
-
Platform Targeting: You’re modeling for a specific technology stack like J2EE, .NET, or embedded C++.
-
Team Alignment: You need a shared vocabulary that bridges technical and non-technical stakeholders.
-
Tool Integration: You want to drive code generation, documentation, or validation from your models.
Importantly, profiles offer “lightweight extensions”—they adapt existing metamodels rather than replacing them. This keeps your models compatible with standard UML tools while adding domain-specific power.
How Profile Diagrams Work Under the Hood
Understanding the mechanics helped me use profiles more effectively. In UML 2.0+, profiles can:
-
Use arbitrary data structures for extended elements (beyond simple strings)
-
Be dynamically combined—multiple profiles can apply to the same model
-
Extend metaclasses via extension relationships (shown as solid arrows with filled heads)
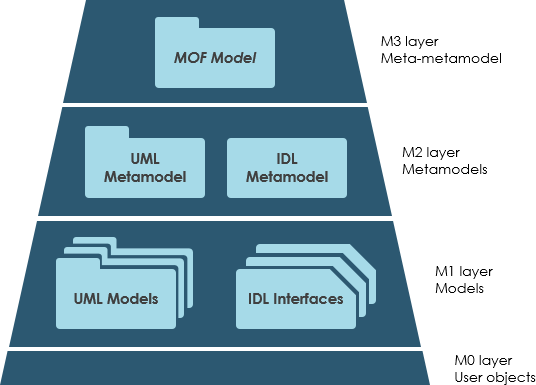
However, profiles have boundaries: they cannot modify existing metamodels or create entirely new ones like MOF does. They customize, not replace.
Profile Diagram at a Glance: A Practical EJB Example
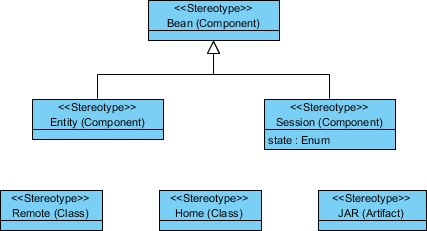
One of my earliest successful profile projects modeled Enterprise JavaBeans (EJB). The profile defined:
-
An abstract
<<Bean>>stereotype extending the Component metaclass -
Concrete specializations:
<<EntityBean>>and<<SessionBean>> -
Associated stereotypes for
<<RemoteInterface>>and<<HomeInterface>> -
A
<<JARFile>>artifact stereotype for deployment packaging
This profile made our Java EE architecture diagrams instantly communicative to both developers and DevOps engineers.
Textual vs. Graphical Stereotypes: Choosing the Right Representation
![]()
Stereotypes can appear as text (<<Controller>>) or custom icons. In MVC framework modeling, I’ve used graphical icons for <<Boundary>>, <<Control>>, and <<Entity>> classes to create visually scannable diagrams. The choice depends on your audience: textual for precision, graphical for rapid comprehension.
Popular Profile Use Cases Across Industries
From my consulting work, I’ve seen profiles successfully applied to:
-
Middleware: CORBA, EJB profiles for distributed systems
-
Languages: C++ or Java-specific modeling conventions
-
Databases: Oracle or MySQL schema extensions
-
Domains: Aerospace safety constraints, healthcare HL7 integrations, financial regulatory rules
Every technical target is a candidate for a well-crafted profile.
Applying Profiles to Your Models: The <> Relationship
To use a profile’s stereotypes, you must apply the profile to your model package using a dashed arrow labeled <<apply>>.
Example I: IT Management Profile Application
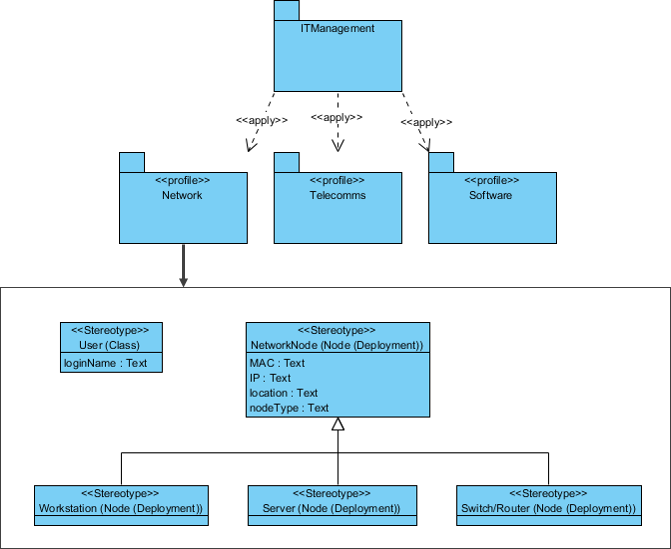
In an IT infrastructure project, I applied Network, Telecomms, and Software profiles to an ITManagement package. This made domain-specific stereotypes like <<LoadBalancer>> or <<Microservice>> available throughout the model.
Example II: EJB Application Profile
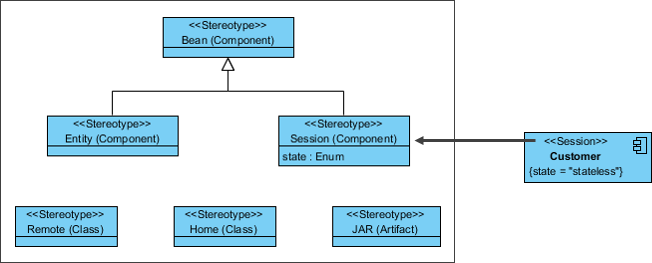
Revisiting the EJB example, applying the profile enabled consistent modeling of beans, interfaces, and deployment artifacts across multiple team diagrams.
Hands-On Tutorial: Creating a Vehicle Engineering Profile in Visual Paradigm
Here’s the step-by-step process I followed to build a custom profile for automotive software modeling:
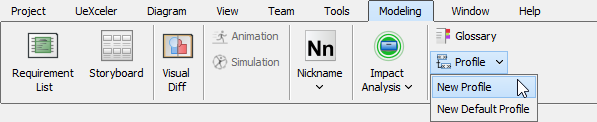
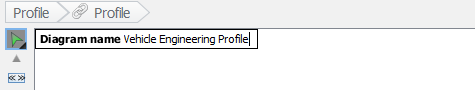
-
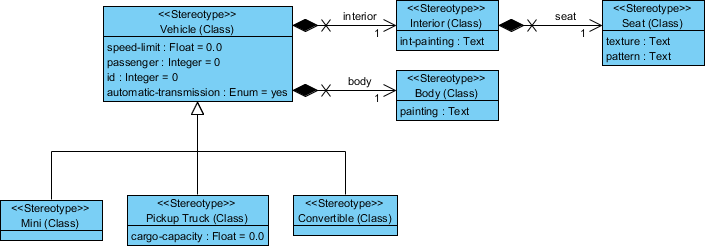
Create a New Profile: Modeling > Profile > New Profile → Name it “Vehicle Engineering Profile”
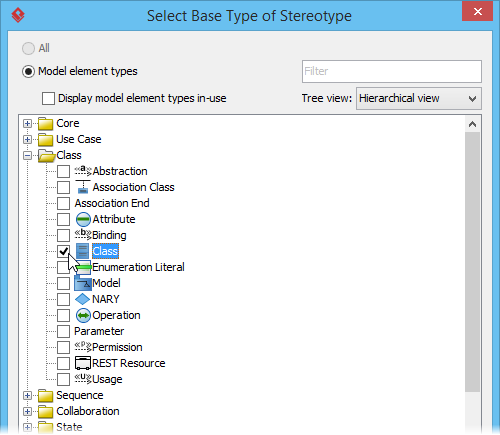
-
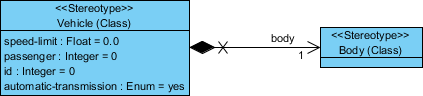
Add a Stereotype: Use the Stereotype tool, select Class as the base type, name it
<<Vehicle>>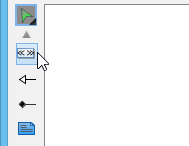

-
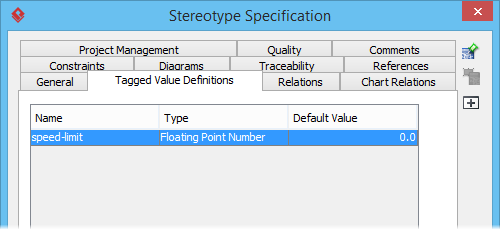
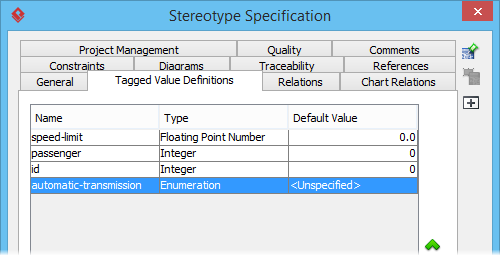
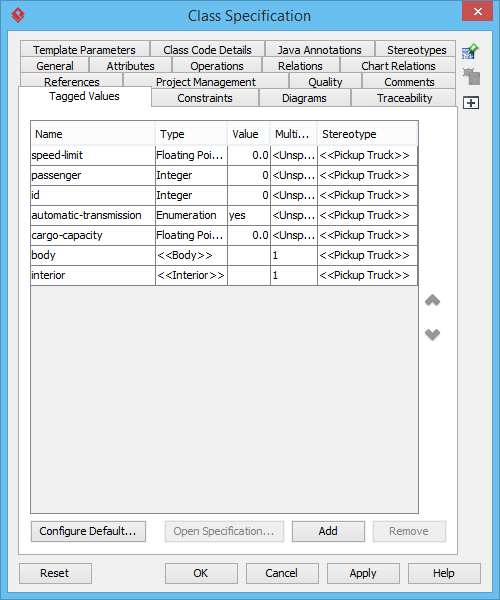
Define Tagged Values: Right-click the stereotype → Open Specification → Tagged Value Definitions tab → Add tags like
speed-limit(floating point),passenger(integer),automatic-transmission(enumeration)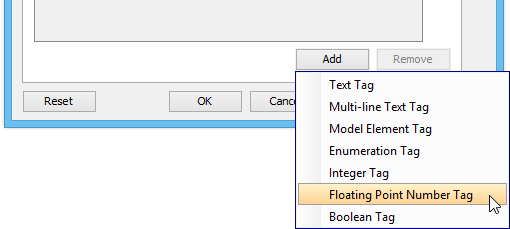
-
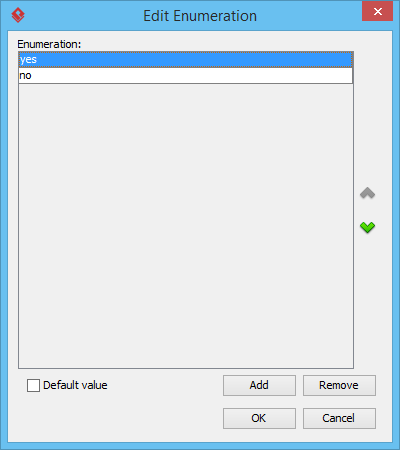
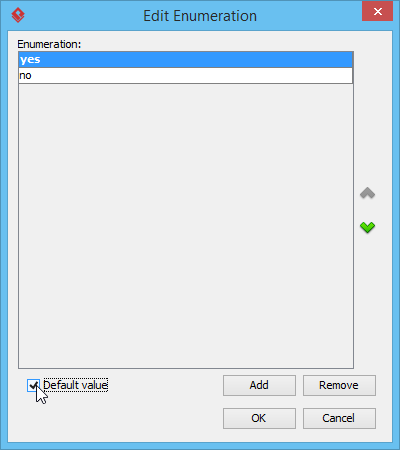
Configure Enumeration Values: For
automatic-transmission, add values “yes” and “no”, set “yes” as default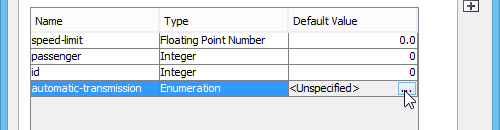
-
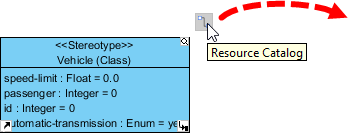
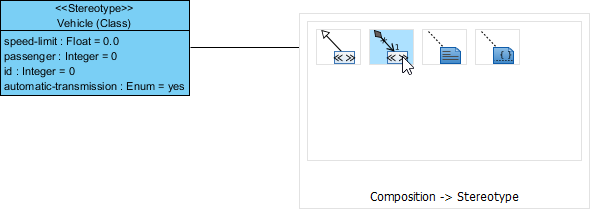
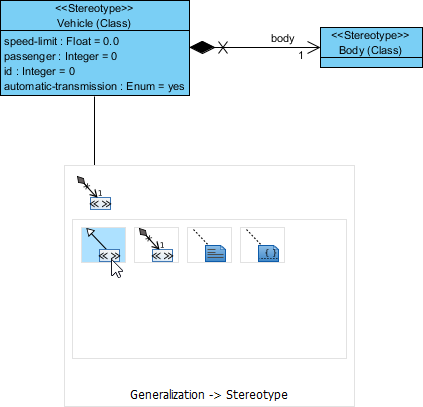
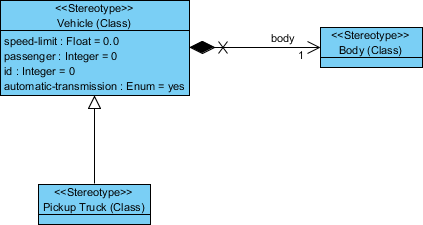
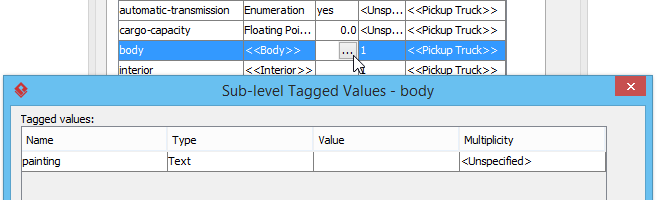
Build Stereotype Hierarchies: Use the Resource Catalog to create composition (
<<Body>>,<<Interior>>) and generalization (<<Pickup Truck>>,<<Mini>>,<<Convertible>>) relationships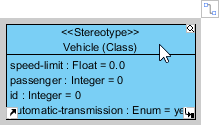
-
Add More Tags: Extend stereotypes with domain-specific properties like
paintingfor Body,cargo-capacityfor Pickup Truck,textureandpatternfor Seat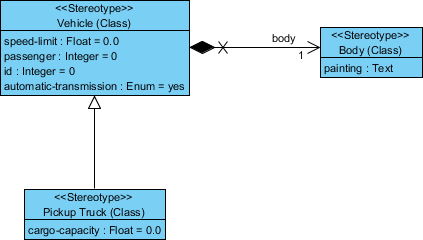
-
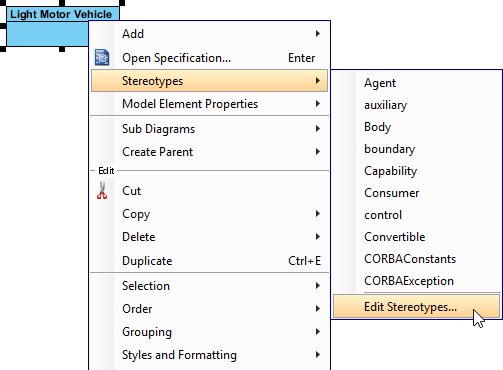
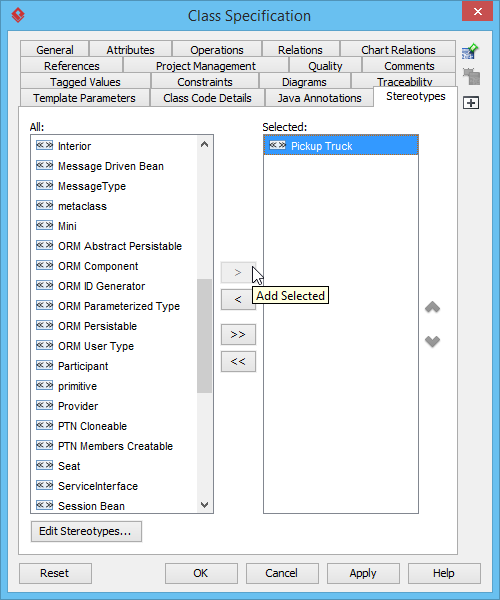
Apply the Profile in a Class Diagram: Create a class like “Light Motor Vehicle”, then assign the
<<Pickup Truck>>stereotype via right-click → Stereotypes → Edit Stereotypes. Tagged values from the profile automatically appear for configuration.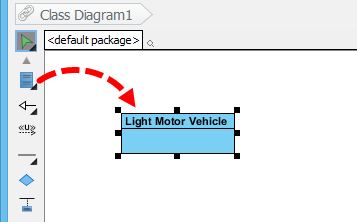
The Game Changer: AI-Powered Profile Diagram Generation
Visual Paradigm Desktop AI Integration
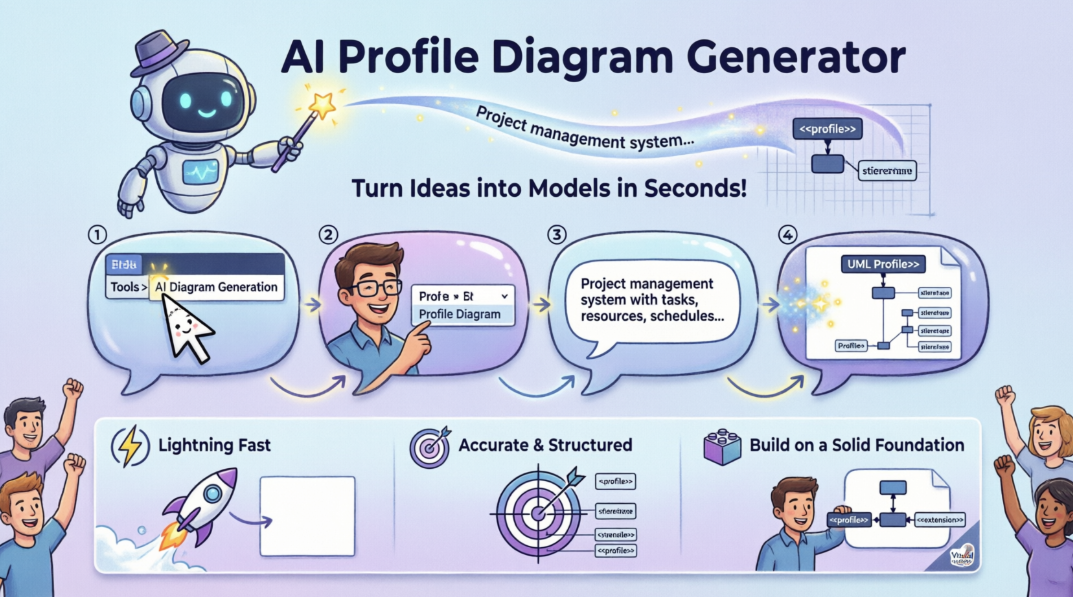
The introduction of AI diagram generation transformed my workflow. Instead of manually placing every stereotype, I can now:
-
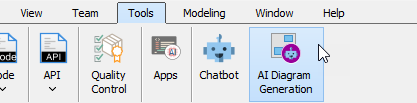
Navigate to Tools > AI Diagram Generation
-
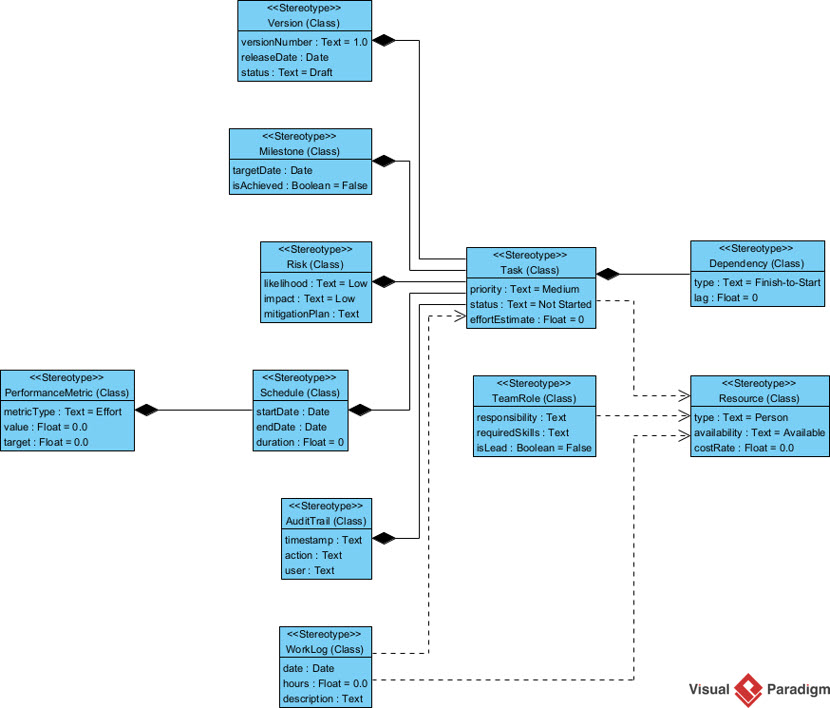
Select Profile Diagram and enter a natural language prompt:
“Generate a Profile Diagram for a project management system specifying extensions for tasks, resources, schedules, and team roles.”
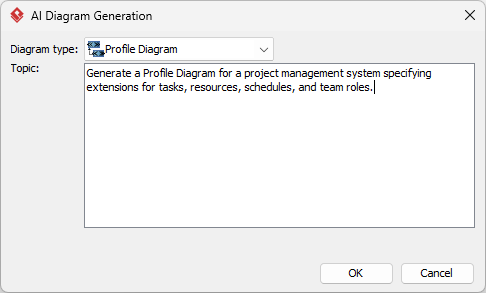
-
Click OK and receive a standards-compliant, editable profile diagram in seconds.
OpenDocs: AI-Powered Documentation with Embedded Profiles
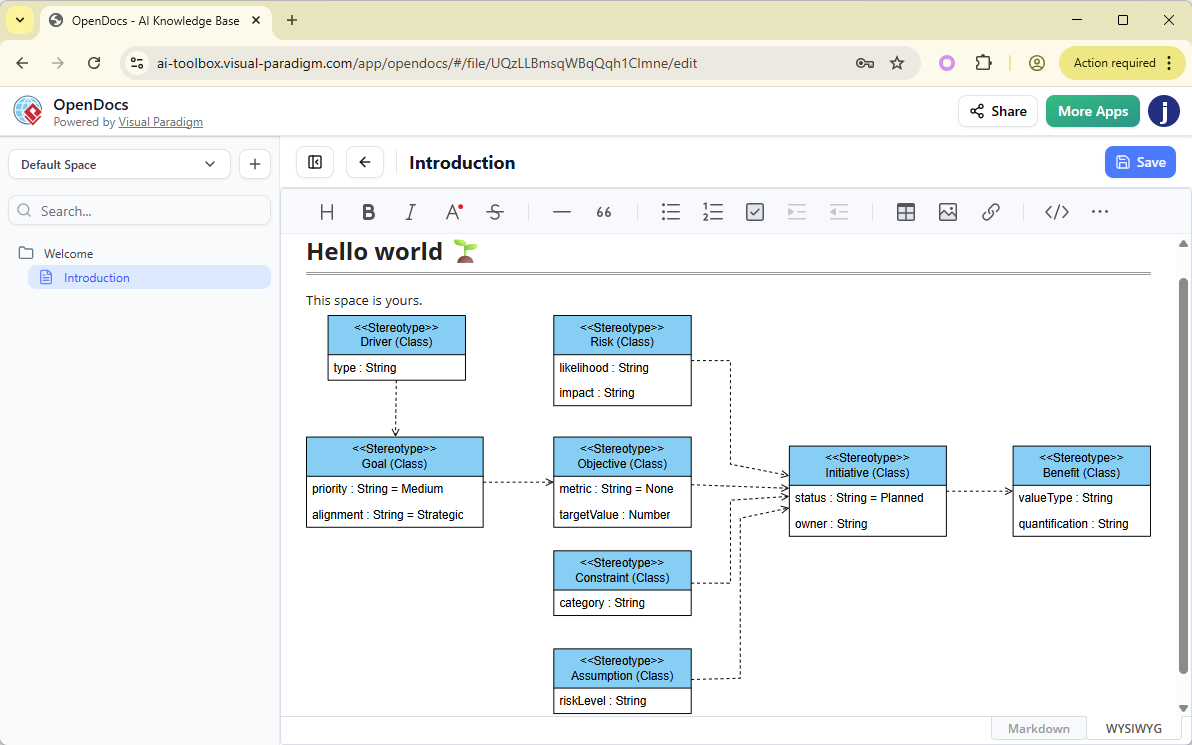
OpenDocs takes this further by embedding profile diagrams directly into living documentation:
-
Click Insert > Diagrams > Profile Diagram in the document editor

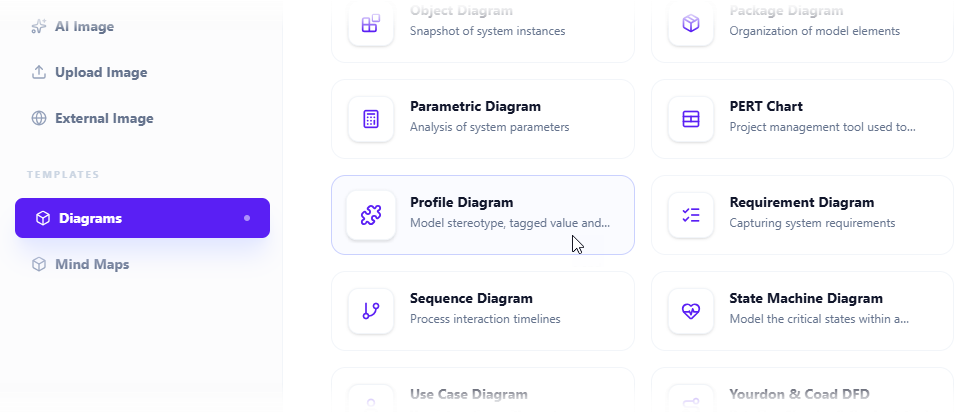
-
Either draw manually using the palette:
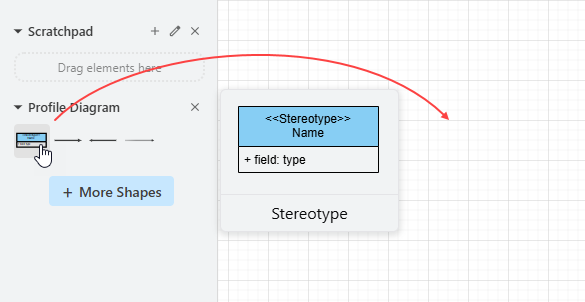
-
Or click Create with AI and describe your requirements:

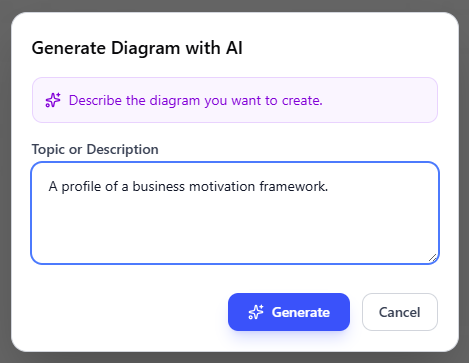
-
Review and refine the AI-generated diagram:
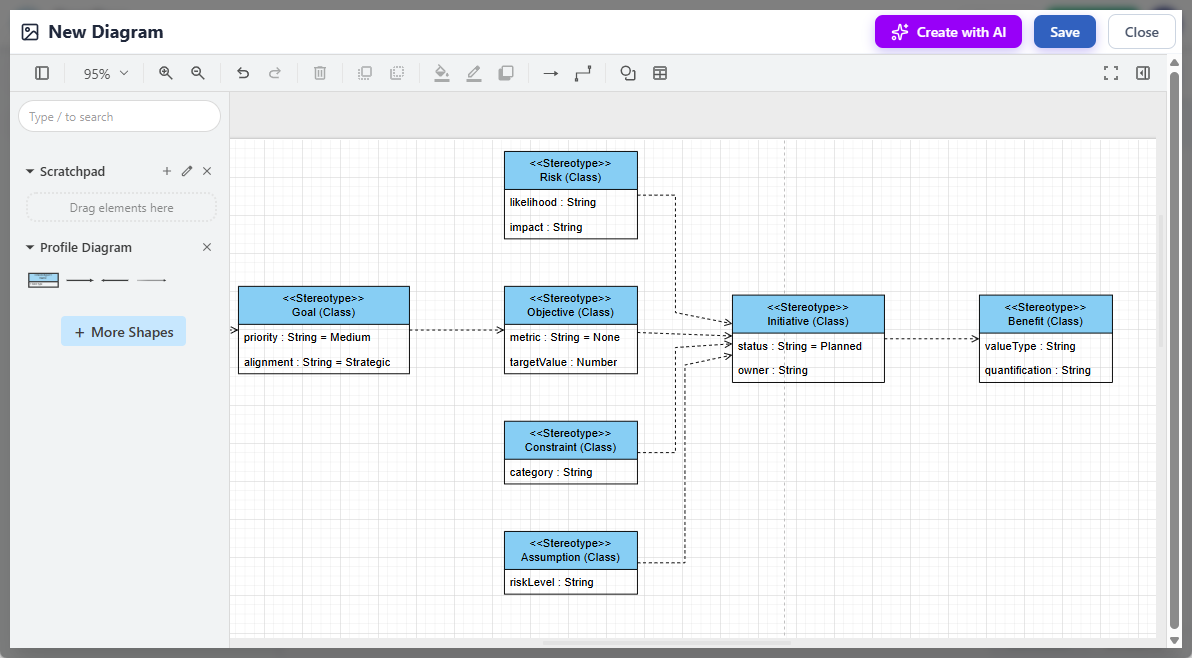
-
Save and embed directly into your documentation:
Traditional vs. AI Approach: My Comparative Experience
| Feature | Traditional Approach | AI Approach |
|---|---|---|
| Effort | Manual dragging, dropping, and aligning of shapes. | Generates complete, standards-compliant diagrams from text prompts in seconds. |
| Control | Full manual control over every element’s placement and properties. | Best for rapid prototyping; generates an editable “living” diagram that can still be refined manually. |
| Technical Skill | Requires knowledge of UML Profile syntax and modeling standards. | Translates plain language into structured models, making it accessible for non-technical users. |
In practice, I use both: AI for initial brainstorming and stakeholder alignment, then manual refinement for production-grade models.
Conclusion: Embracing Extensibility in a Complex World
My journey with UML Profile Diagrams has been one of empowerment. What began as a niche modeling technique has become central to how I bridge domain expertise with technical architecture. The combination of UML’s rigorous foundation, Visual Paradigm’s intuitive tooling, and emerging AI capabilities creates a powerful trifecta for modern software engineering.
If you’re modeling complex, domain-specific systems, I encourage you to explore Profile Diagrams. Start small—define one stereotype for your most frequent concept. Experiment with tagged values to capture metadata that matters to your team. And when you’re ready to scale, leverage AI generation to accelerate prototyping without sacrificing precision.
The future of modeling isn’t about choosing between rigor and agility—it’s about tools that deliver both. With Profile Diagrams and the right platform, you can have your UML and customize it too.
References
- AI Deployment Diagram Generator in OpenDocs: Announcement of AI-powered UML Deployment Diagram support in Visual Paradigm’s OpenDocs knowledge management tool.
- AI Package Diagram Generator for Visual Paradigm Desktop: Release notes detailing AI generation capabilities for Package Diagrams in Visual Paradigm Desktop to accelerate software design.
- UML Profile Diagram Tutorial Video: Video tutorial demonstrating how to create and use UML Profile Diagrams in Visual Paradigm.
- AI Activity Diagram Generation in Visual Paradigm Desktop: Update announcing AI-powered Activity Diagram generation features in the desktop application.
- Visual Paradigm Desktop AI Features Demo: Video demonstration of AI diagram generation capabilities within Visual Paradigm Desktop.
- Drawing a Profile Diagram – Visual Paradigm User Guide: Official step-by-step documentation for creating UML Profile Diagrams manually in Visual Paradigm.
- Profile Diagram Naming and Creation Guide: Specific section of the user guide covering profile diagram naming conventions and initial setup.
- AI Profile Diagram Generator Tool Update: Major update announcement introducing AI-powered Profile Diagram generation in Visual Paradigm Desktop.
- AI Profile Diagram Generator – Feature Overview: Detailed overview of the new AI Profile Diagram generation workflow and capabilities.
- AI Diagram Generator Expands to 13 Diagram Types: Release notes covering the expansion of AI diagram generation support to include Profile Diagrams and 12 other UML types.
- Visual Paradigm Online Diagram Compatibility: Documentation outlining which diagram types, including Profile Diagrams, are supported in the web-based Visual Paradigm Online platform.
- Online vs. Desktop ER Diagram Tools Comparison: Third-party comparison discussing trade-offs between online and desktop diagramming tools, relevant for choosing a Profile Diagram environment.
- AI Diagram Generator – 13 Types Supported: Announcement detailing the broadened scope of Visual Paradigm’s AI diagram generation feature set.
- Visual Paradigm AI Features Walkthrough: Video tutorial showcasing various AI-powered diagramming features in Visual Paradigm.
- AI Component Diagram Generator in OpenDocs: Update announcing AI generation support for Component Diagrams within the OpenDocs documentation platform.
- UML Profile Diagram Support in OpenDocs: Official announcement of UML Profile Diagram creation and AI generation capabilities in Visual Paradigm OpenDocs.
- OpenDocs Profile Diagram Feature Details: In-depth feature description of Profile Diagram workflows within the OpenDocs environment.
- AI Profile Generation in OpenDocs – User Guide: Step-by-step instructions for using AI to generate Profile Diagrams directly within OpenDocs documents.
- AI State Diagram Generator in OpenDocs: Update covering AI State Diagram generation in OpenDocs, demonstrating the consistent prompt-based workflow across diagram types.
- Why Teams Need an AI Diagram Maker: Blog post discussing the productivity benefits of AI-powered diagramming tools for project initiation and collaboration.
- Turning Requirements into Diagrams with AI: Practical guide on using AI chatbot interfaces to transform textual requirements into visual UML models.
- Hands-On Review: Visual Paradigm AI Flowchart Generator: Independent third-party review evaluating the usability and output quality of Visual Paradigm’s AI diagram generation features.
- Visual Paradigm AI vs. General LLMs: Comprehensive Guide: Comparative analysis of Visual Paradigm’s domain-specific AI modeling tools versus generic large language models for diagram creation tasks.
